Cycle time in agile projects
Predictability is an important factor in many projects. Especially in heavily regulated industries, e.g. healthcare or finance, is an expectation that deadlines won’t be missed, and communicated project scope will be delivered. Most of Scrum Masters are already using agile metrics to understand team dynamic and create realistic plans. Most common metrics are velocity and burndown rate. Here I’d like to tell you about rarely used metric which is cycle time, and how we could use it to understand your team better and improve project outcomes.
At the end of post, you can find a link to Google Colab notebook (https://colab.research.google.com/) that will create all charts for you. Only thing you need to do is to copy it to your Google Drive and create configuration file with your Jira credentials.
Definition
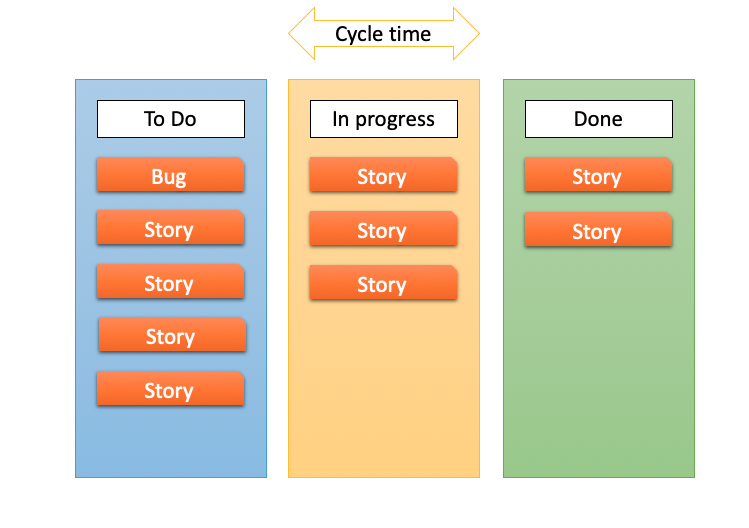
Cycle time is a time that issue spend in progress, after it went from To Do status and before it will land in Done category status.

If you’re using Jira, you can use out of a box chart that will visualize cycle time for you. It’s called Control Chart and you can find clarification on how it works here: https://www.atlassian.com/agile/project-management/metrics It is great chart, but it lacks granularity. In most situations stories are not in the same size. Average cycle time might not tell us much in projects when size variation is substantial.
Granular approach to cycle time calculations
Below you can see an example histogram for all stories in a project that are estimated to have size of 2 story points (SP).

What you can learn from above chart:
- Cycle time median is 6 days – half of stories are finished before 6 days and half after this time.
- There are 2 outliers that took 16 days or more. Number of outliers is not high. It seems that the team is ready to take risks but they’re mostly well calculated.
- Most of stories seems to lie under a bell curve. I’d risk interpretation that 2 SP stories are well defined and well estimated before taken to in progress state by developers.
- There is a spike around 3 days on the histogram. It would be good to understand why so many stories were finished in half of median time. Maybe it could give ideas on how to improve cycle time for other issues?
How to generate cycle time histograms?
Under following link you can find Google Colab hosted Jupyter Notebook that will do all above calculations. All you need is Jira project, Google Drive and config file with your Jira credentials. https://colab.research.google.com/drive/1i5Q8--ahdzDa6yHMWJmlNyFyJCf7TjD8
In next post I’ll show you how to use above knowledge to monitor your in-progress work and spot potential outliers early and react when they’re still developed to avoid unnecessary cycle time increase. Stay tuned!
If you're interested on how to use python with Jira to improve your results as a Agile Managere check other posts: Jira and python for Managers